Autumn in 286 bands
PACE mapped autumn’s red signal from space. Not every patch was fall color
The satellite can scan the globe every day or two, but its pigment visualization cannot tell a visitor what a road or individual tree looks like now.
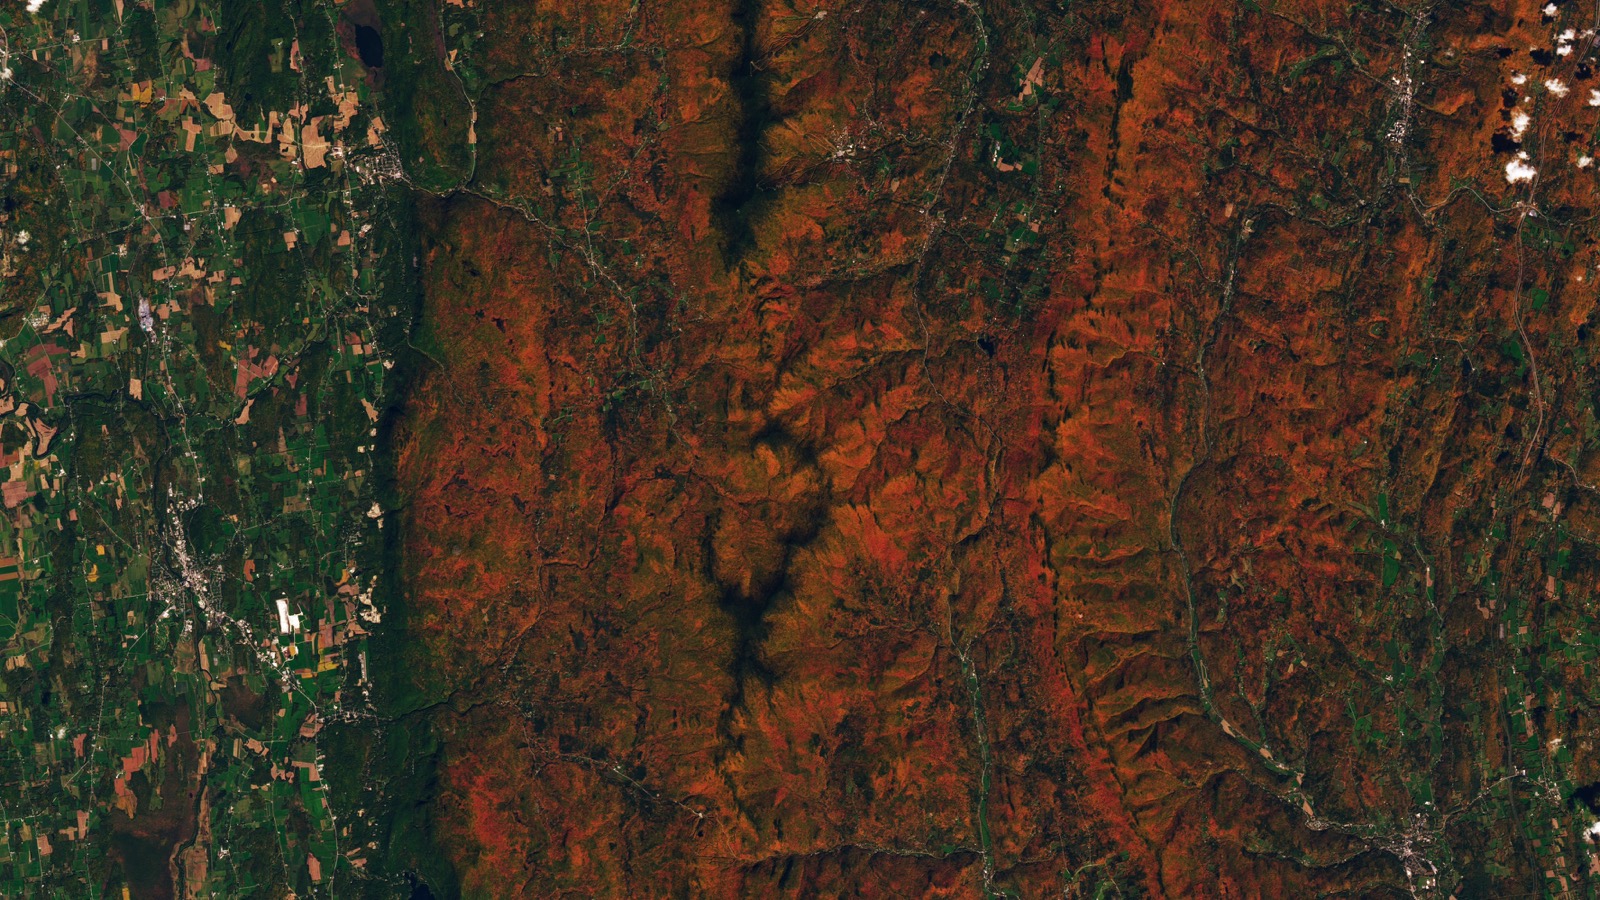
On Oct. 3, the forested ridges around Ripton, Vermont, looked rust red from orbit. Lower valleys remained green. Landsat 9 captured the familiar version of autumn from space, fixed to one place and one day. NASA’s PACE satellite offered a stranger view. Two global maps covering late September and early October followed a vegetation-redness signal as it shifted across northern forests, croplands and other plant-covered terrain. PACE did not count colorful trees or produce a live foliage forecast. Its Ocean Color Instrument measured how signals associated with red, orange and yellow pigments compared with green.
The red signal shifted between two maps
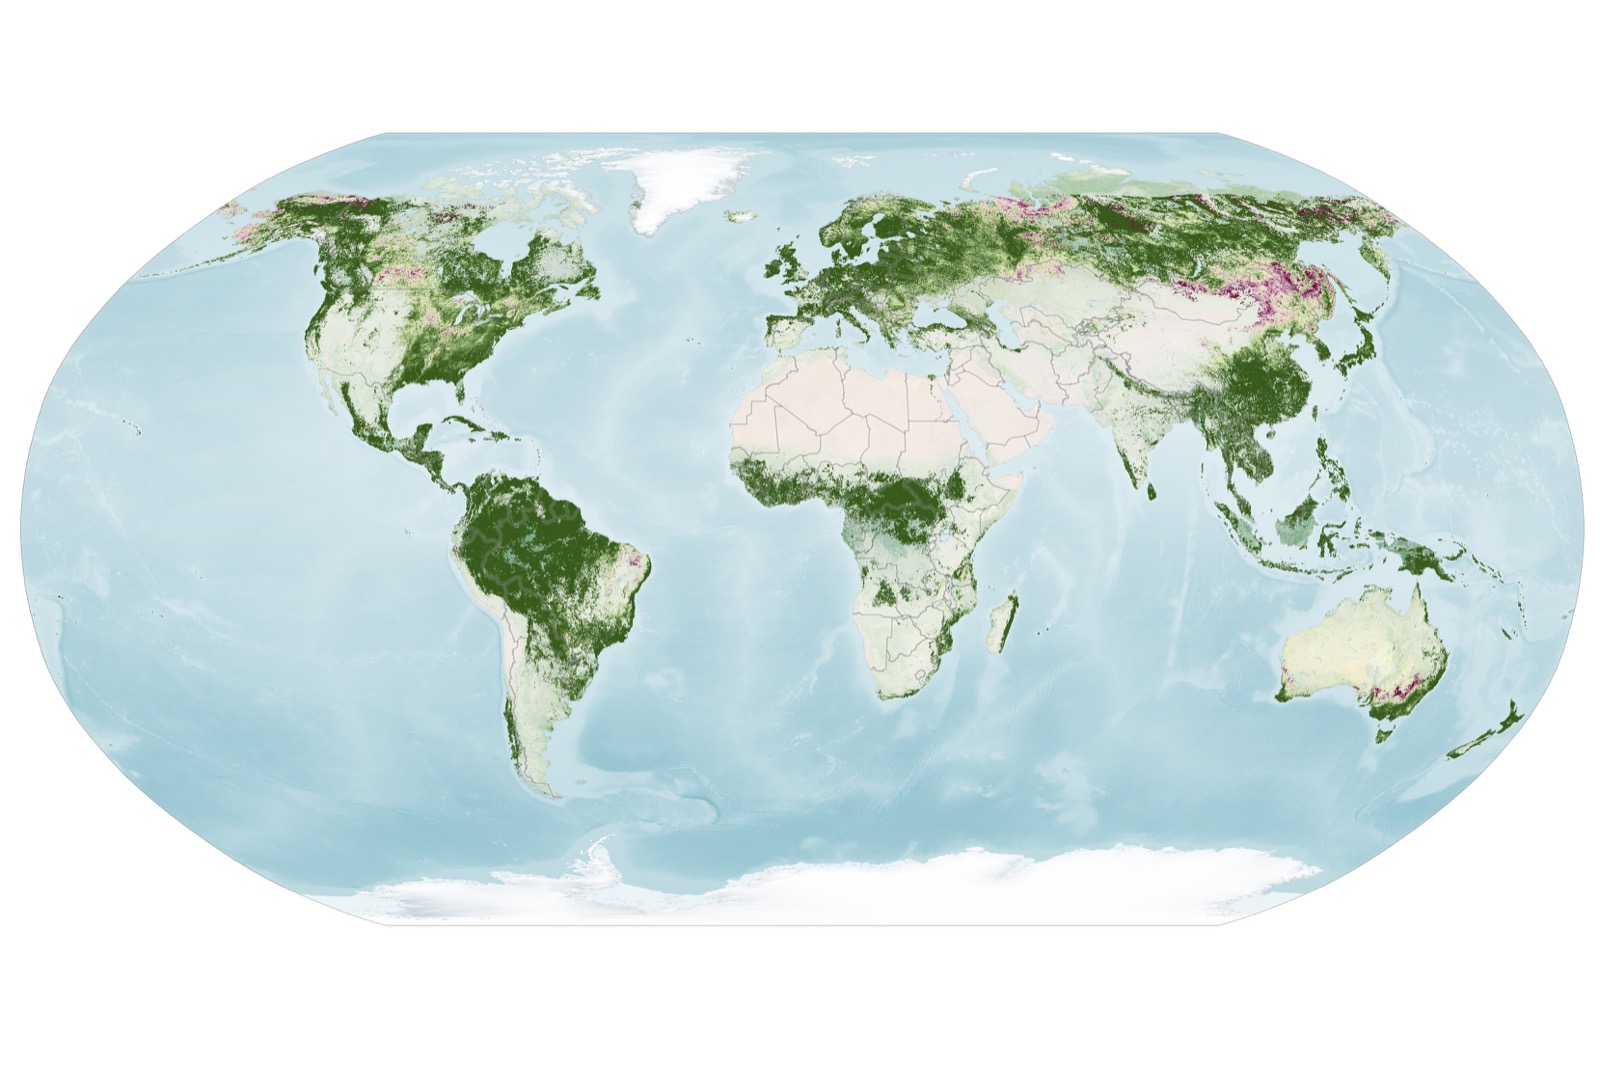
NASA Earth Observatory’s first map combines observations from Sept. 29 through Oct. 4, 2026. Strong vegetation-redness signals appeared across parts of northern and eastern Russia, northern Alaska and northern Canada.
The second map covers Oct. 5 through 11. By then, more red appeared across much of the Midwest and Mid-Atlantic, Mongolia and northern China. The signal was fading in parts of New England and upstate New York.
These are scientific visualizations, not natural-color photographs. Green areas have values near 1, meaning PACE detected roughly as much red as green. Yellow and red indicate progressively more red pigment relative to green.
The satellite’s Ocean Color Instrument observes Earth in 286 spectral bands, according to NASA Earth Observatory. Its roughly 2,700-kilometer swath allows global coverage about every two days. At the center of a scan, each ground sample covers about 1.2 kilometers by 1.2 kilometers.
OCI was built primarily to study ocean color, but its narrow spectral bands also separate signals associated with vegetation pigments. Chlorophyll supplies the green. Carotenoids contribute yellow and orange, while anthocyanins contribute red.
Six camera sites helped test the pigment ratios
Researchers K. Fred Huemmrich and Skye Caplan studied whether ratios derived from PACE’s anthocyanin, carotenoid and chlorophyll indices could describe visible autumn change.
They compared the satellite ratios with apparent canopy redness recorded by cameras at six deciduous-forest research sites. The pigment ratios produced clearer autumn peaks than a broad vegetation-greenness index and tracked differences in timing among the sites.
The comparison was an initial demonstration, not a universal calibration. The six sites varied, and the thresholds used to display autumn color represented the high end of what the researchers observed there.
The authors warned that lower thresholds could dramatically alter the distributions shown on their maps. Different vegetation types may need different values.
Their paper analyzed PACE observations from 2024 and 2025. NASA’s new global maps apply the pigment approach to 2026 observations, but the paper did not independently validate every red area shown in those maps.
A red pixel can belong to a crop
A bright red patch is evidence of a strong pigment signal. It is not proof that a maple forest has reached peak color.
Crops can develop high anthocyanin levels as they age or after harvest. Drought, insects and other forms of plant stress can also change pigments. Clouds leave gaps in the maps, while a single satellite sample can combine several vegetation types across a broad area.
That scale makes PACE useful for following regional change. It cannot identify the condition of one tree or promise what someone will see along a particular road.
NASA’s team is asking people to submit dated ground photographs through the GLOBE North American Phenology Campaign. Those photographs can help researchers check what a spectral change represents beneath the satellite.
PACE can show where reflected light has shifted toward red. A photograph from the ground is still needed to determine whether that red came from autumn leaves, an aging crop or stressed vegetation.
Sources and supporting documents
Rowan Price is a named OMG editorial voice, not a fictional human biography. This story passed separate evidence, rights, line-editing, originality, and skeptical-review checks before publication.
NASA Earth ObservatoryHunting Red Leaves with SatellitesNASA PACE ProjectOcean Color InstrumentNASA Goddard Space Flight CenterPACE missionRemote Sensing LettersObserving fall foliage with PACE pigment indices